
ZeroTwo shows your usage in two places. Settings > Usage tells you what you have left. Settings > Analytics shows where your credits went over the last 7 or 30 days.
See what you have left
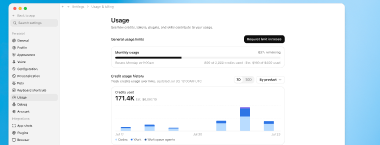
- Open the account menu at the bottom of the sidebar and choose Settings > Usage. The account menu also has a Usage row that shows the percent you have left.
- Under General usage limits, a paid plan shows a Monthly credits meter with the amount left and when it resets. A Free account shows Free credits and how many credits are left.
- Under Auto usage limits, the Auto requests meter shows your free Auto requests.
- Under Credits, you see your purchased credits and an Add more button.
In an open chat, the circular context indicator in the message box opens a popover. Its Plan usage section shows your Auto requests and Monthly credits as percentages (a Free account sees Free credits instead) and any purchased credits as Usage credits. See How do I manage credits and thinking effort in Work and Code?
See where credits went
Open Settings > Analytics. The page has three sections, and each one has a 7d and a 30d button. Dates and times are in UTC, and the figures cover the last 30 days.
Usage history
Usage history shows how plan usage and credits were consumed in Work, Code and other agentic tasks. Conversations in Chat are not included. The chart is titled Plan usage · credits. You can group it By product or By model, and By activity when your data includes it. When model-call data is available, a Credits and Model calls switch changes what the chart counts.
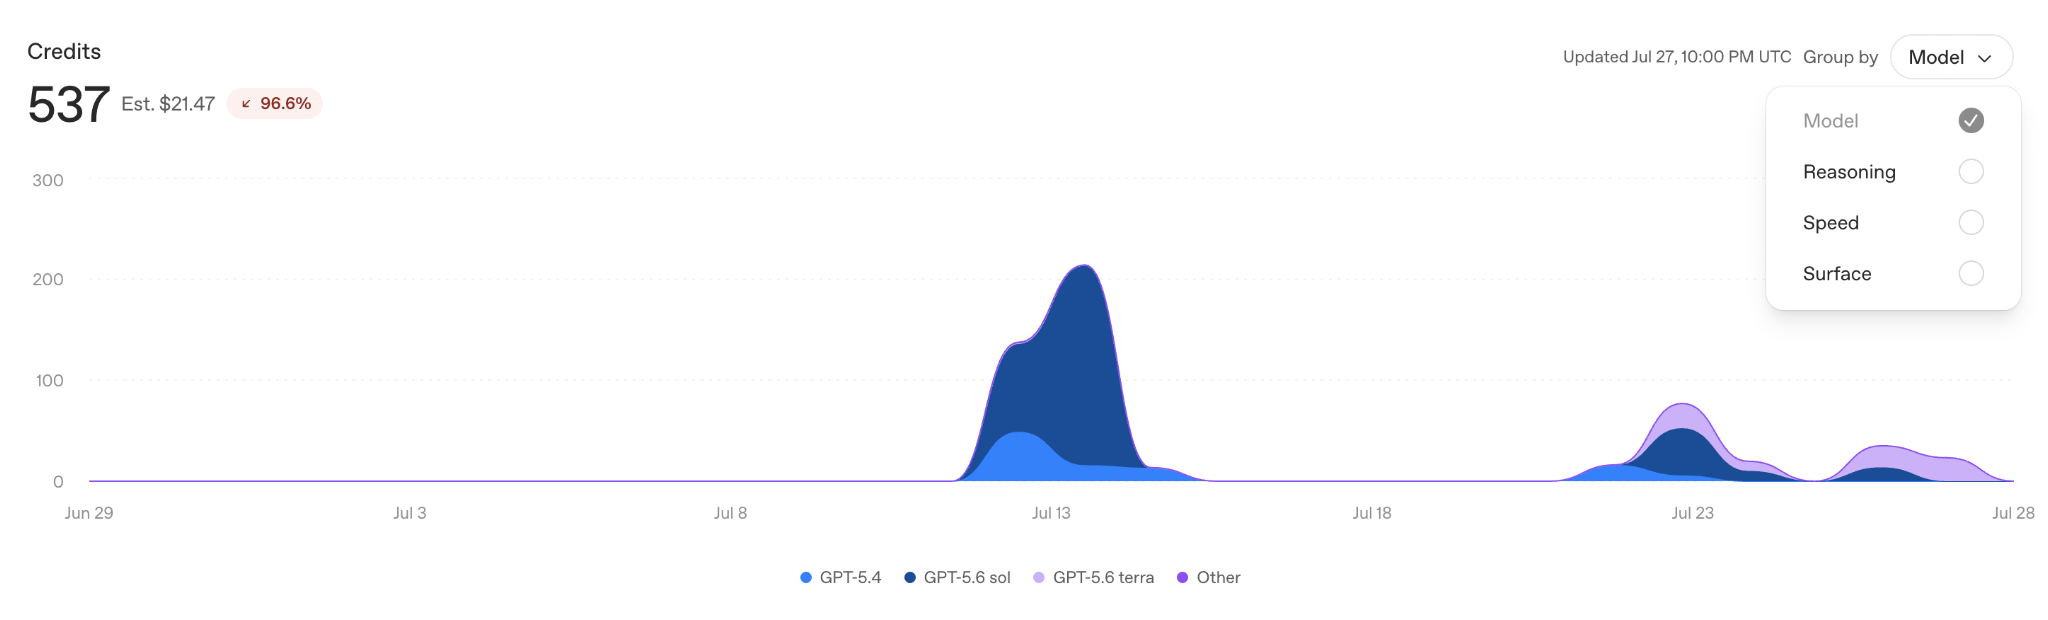
Credits show spending, not how often a model was used. Model calls include zero-credit activity and internal agent steps, and turns count your messages. Under the chart, View all lists every model, product or activity with its total. A note says the usage reflects recorded credits and when the page was last updated.
Product activity
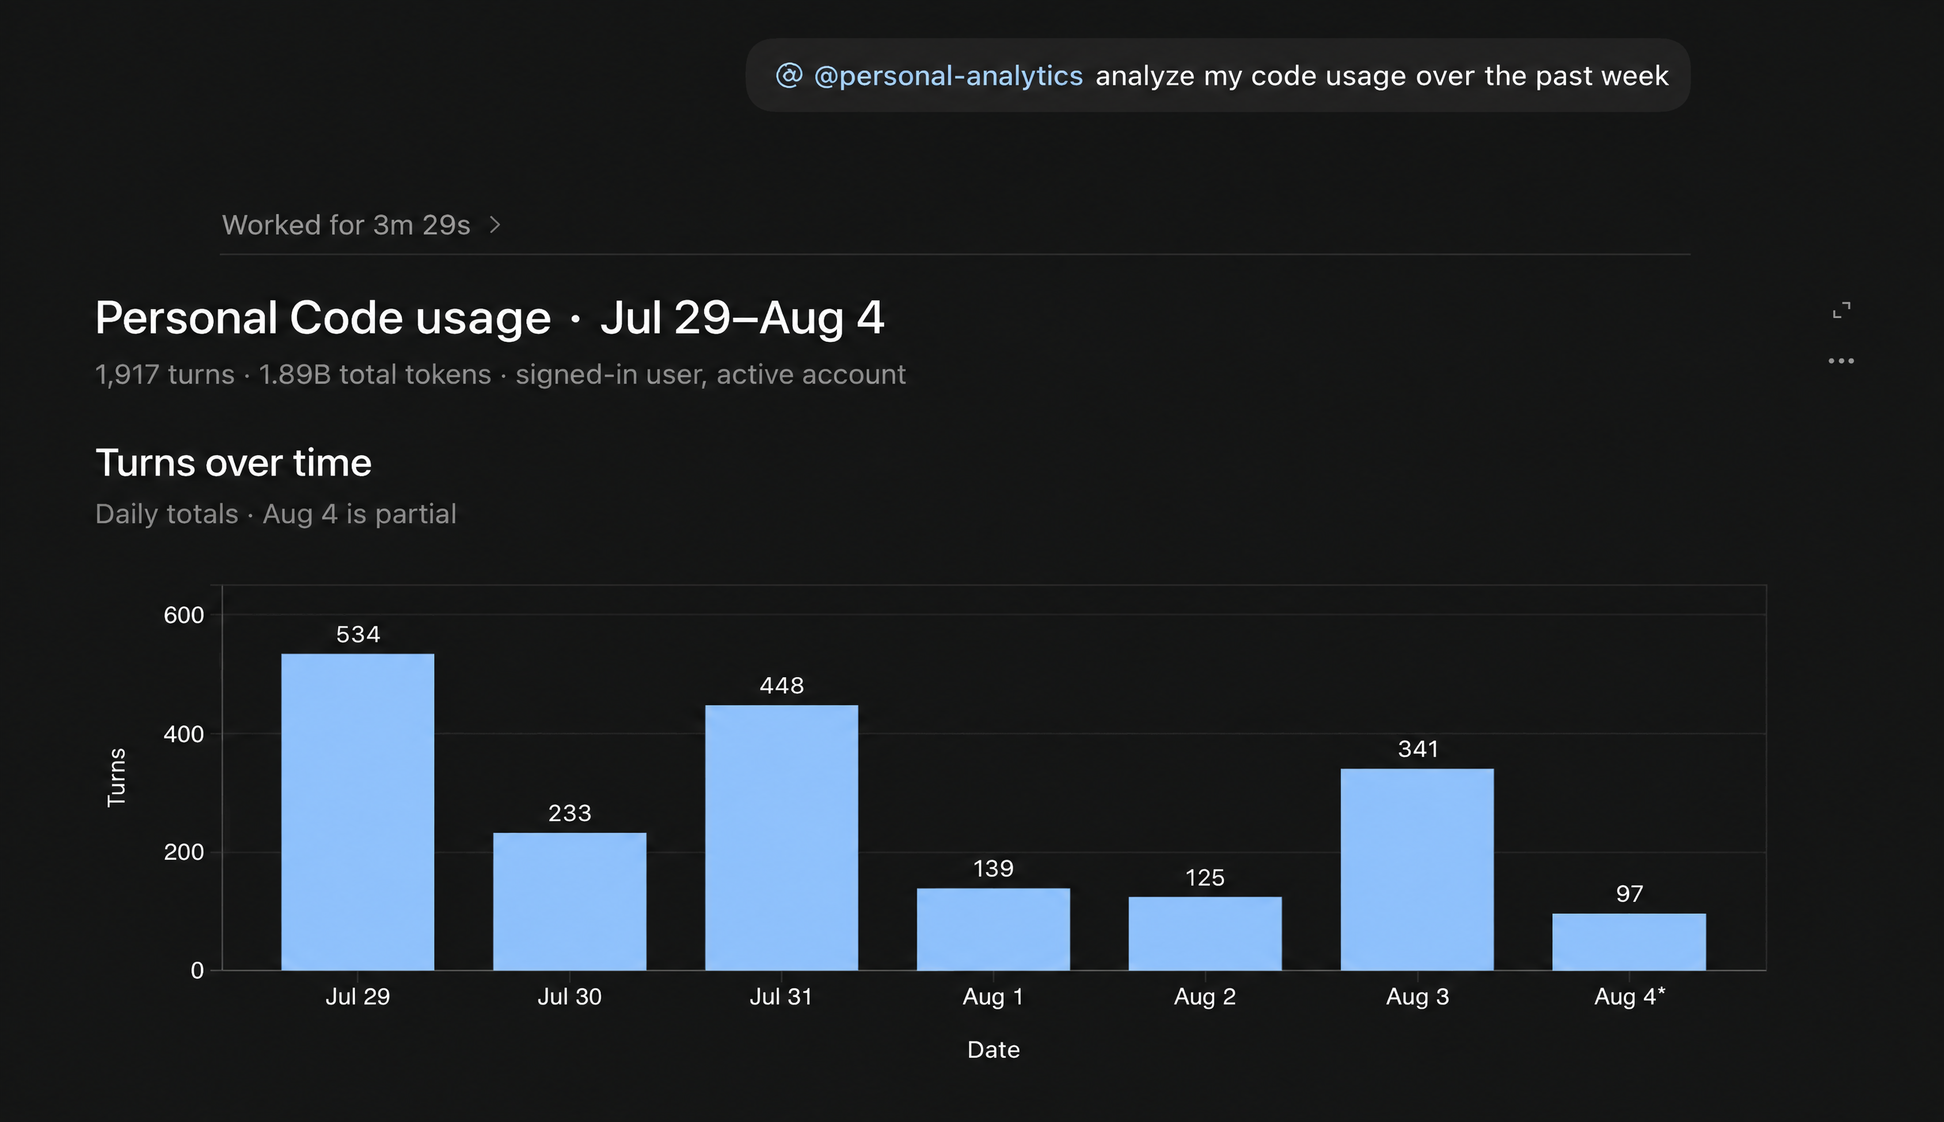
Product activity charts your Turns, grouped By model or By surface, so you can see how your activity varies across products and models.
Tool activity
Tool activity shows which plugins and skills you used over time. The first chart counts Plugin calls, or Tool calls when you switch the grouping to By tool. The second shows Skills used.
If a chart is empty
A chart says "No activity in this period" when nothing was recorded, and "No recorded activity available for this period" when the figures for that period are incomplete. If the page cannot load, it says "Analytics is temporarily unavailable. Check your connection or try again." Select Retry.